In order to estimate the potential eruption hazard in a region, probabilistic modelling of volcanic eruption products is carried out to identify the areas most at risk of being affected. The main input for the model is a long-term volcanic hazard map calculated several years in advance using QVAST (QGIS for VolcAnic SuscepTibility) which is one of the QGIS plugins. The long-term volcanic hazard map uses geological information such as the location and age of conduits, faults, fractures, as well as seismic and deformation data. The probability density function of each feature class is weighted differently through expert judgement elicitation and combined through a Poisson point process. To move from long-term to short-term volcanic vulnerability estimates, information from long-term geological, seismic and deformation data will be combined with information from recent monitoring and research data to determine the likely location of the eruption centre, and then eruptive material distribution modelling will be performed to produce a more probabilistic hazard map.

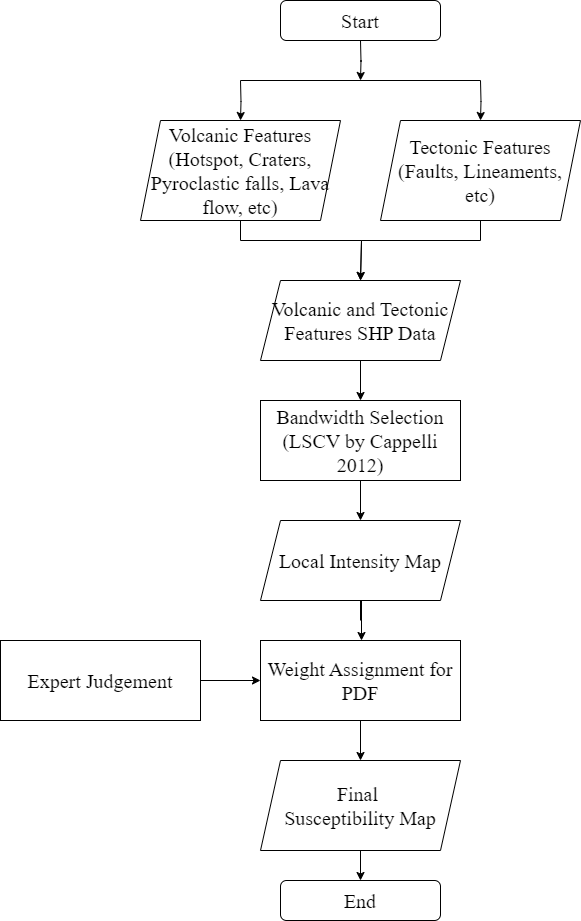
In conducting susceptibility analysis, several steps must be done sequentially. The methodology is structured into several steps: data collection, database development, probability density function, expert judgment for weighting, and susceptibility mapping using the QVAST plugin within the VOLCANBOX suite.
Data Collection and Database Development
The first thing to do is to prepare the data collection. The data required are volcanic and tectonic features, both of which play a role in the data collection. The initial stage involved building a database containing all relevant geological features to aid in determining potential eruption locations. The database is divided into volcanic features and tectonic features
Probability Density Function and Local Intensity Mapping
The analysis involved the use of a probability density function (PDF) to generate local intensity maps for each feature. The bandwidth for each feature was calculated using Least Squares Cross-Validation (LSCV), which determines the optimal smoothing parameter for spatial data. The results of the bandwidth calculation then proceeded to the calculation of the probability density function (PDF). The result of the PDF analysis is a local intensity map of each shapefile which will then become a parameter in the final susceptibility calculation.
Expert Judgment, Estimating The Weight Used for The Final Susceptibility Map
The determination of the weights used for susceptibility mapping is based on expert judgment and is given in the form of a range of values. Each parameter will be entered into the weight value and processed by trial and error, then if the results obtained are following the judgment of the experts the exact weight value used can be determined. The experts used the division of susceptibility level restrictions on parameters. Parameters that have a high risk are at 45-55%, then the medium level is at 10-25%, and the lowest level is at <5%.
Susceptibility Mapping and Spatial Probability Calculations
The final step involved the creation of a comprehensive susceptibility map using QGIS, an open-source Geographic Information System. The VOLCANBOX suite’s QVAST plugin was employed to integrate all the weighted parameters and calculate the overall spatial probability of future vent openings. The susceptibility map was generated by applying a non-homogeneous Poisson process, which models the probability of vent activation based on the combined data inputs. The output map highlights regions with varying levels of susceptibility, ranging from low-risk zones (indicated in blue) to high-risk zones (indicated in red). The map serves as a crucial tool for hazard management and risk mitigation, offering a detailed visual representation of potential future eruption sites.
This website uses cookies to provide you with the best browsing experience.